300+ Copywriting Statistics For Marketers in 2024
One of the major obstacles in modern copywriting is establishing a bond with a vast online audience. Copywriters have various strategies at their disposal, such as persuasion, humour, psychology, and more. The choice of approach depends on factors like the topic, objective, target audience, and even the writer themselves.
However, we also have another resource available: solid data. Whether your content will be featured online, on social media, or in email inboxes worldwide, there are copywriting statistics that uncover successful strategies used in these channels before. You can utilize this information to create and share your own captivating copy with the aim of captivating a larger audience.
As we move forward into 2024, this article offers over 300+ copywriting statistics to give you insights into the current trends in the industry. Gain an understanding of how other businesses strategize and seize the opportunities that lie ahead in 2024.
Let’s get started
300+ Copywriting Statistics for 2024
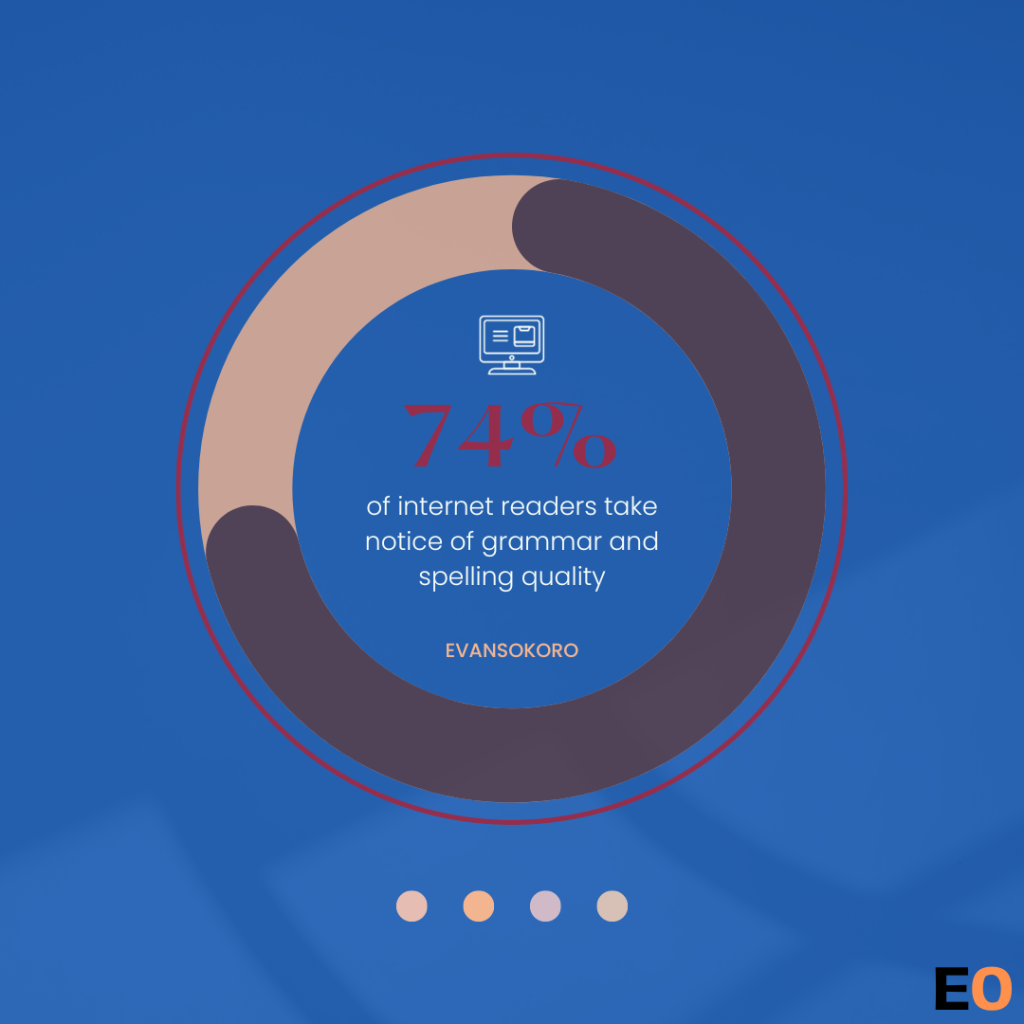
- 74% of web users pay attention to the quality of the spelling and grammar on company websites
- 59% would actually avoid buying from a company that made obvious spelling or grammar mistakes
- Using the word “you” in marketing messages can increase conversions by up to 47%
- Headlines with questions can increase website traffic by up to 480%
- Simple subject lines get 541% more responses than creative ones.
- Freelance copywriters earn an average yearly salary of $49,989.
- The typical age of a working freelance copywriter is 41 years old.
Blog Statistics
- Headlines containing 10 to 13 words draw in twice the amount of site traffic.
- Listicles attracts 80% more page views than other forms of content marketing.
- Content that includes at least one list within every 500 words attracts 70% additional traffic.
- 80% of visitors will solely peruse the headline of a page or article.
- A blog post should ideally take around seven minutes to read.
- Including a hyphen or colon in the headline boosts click-through rates by 9%.
- Around 409 million individuals browse over 20 billion web pages monthly.
- 46% of bloggers take on the task of self-editing their own work.
- 54% of bloggers have their work reviewed by editors or other individuals.
- Companies that engage in blogging receive 97% more website links.
- A few times per month, around 66% of bloggers are publishing their content.
- Around 60% of blogs release anywhere from one to five guest posts on a monthly basis.
- 77% of online users engage in reading blogs.
- Internet users in the U.S. spend three times more time on blogs than on email.
- Just 38% of bloggers make updates to their older articles.
- Websites with a blog are proven to have a staggering 434% increase in indexed pages.
- Roughly 5% of bloggers lack access to analytics.
- Companies that engage in blogging witness a twofold increase in email traffic.
- According to a survey, the credibility of blogs increases when they have multiple authors, with 62.96% of readers perceiving them as more trustworthy.
- Most bloggers prefer writing how-to articles and list articles.
- Due to inadequate mobile display, 93% of website visitors have abandoned the site.
- Due to its inadequate design, 90% of website visitors leave without engaging.
- Out of all freelance copywriters, 53.7% are women, while men make up 46.3% of the total.
“Bloggers who create articles exceeding 2,000 words are significantly more inclined to achieve favourable outcomes.”
- According to a survey, more than half of bloggers struggled to engage readers with their content.
- 30% of internet users use Adblock, making organic content important.
- Personalized calls to action (CTAs) increase conversion chances by 202%.
- Pages with one CTA link have a higher average conversion rate.
- Landing page traffic that originates from email produces the highest conversion rate (13%).
- 37% of the top landing pages include testimonials.
- 73% of people admit to skimming rather than reading a blog post.
- On average, web pages are typically visited for around 15 seconds, regardless of their length.
- Readers only consume 20% of content on a page.
- Visitors will spend an additional 4.4 seconds on a page for every extra 100 words.
- 79% of people usually don’t read web copy at all. Instead, they scan and skim.
- Two- to three-letter words are skipped over nearly three out of four times.
- Compelling copy draws 7.8 times more site traffic and produces better brand recall.
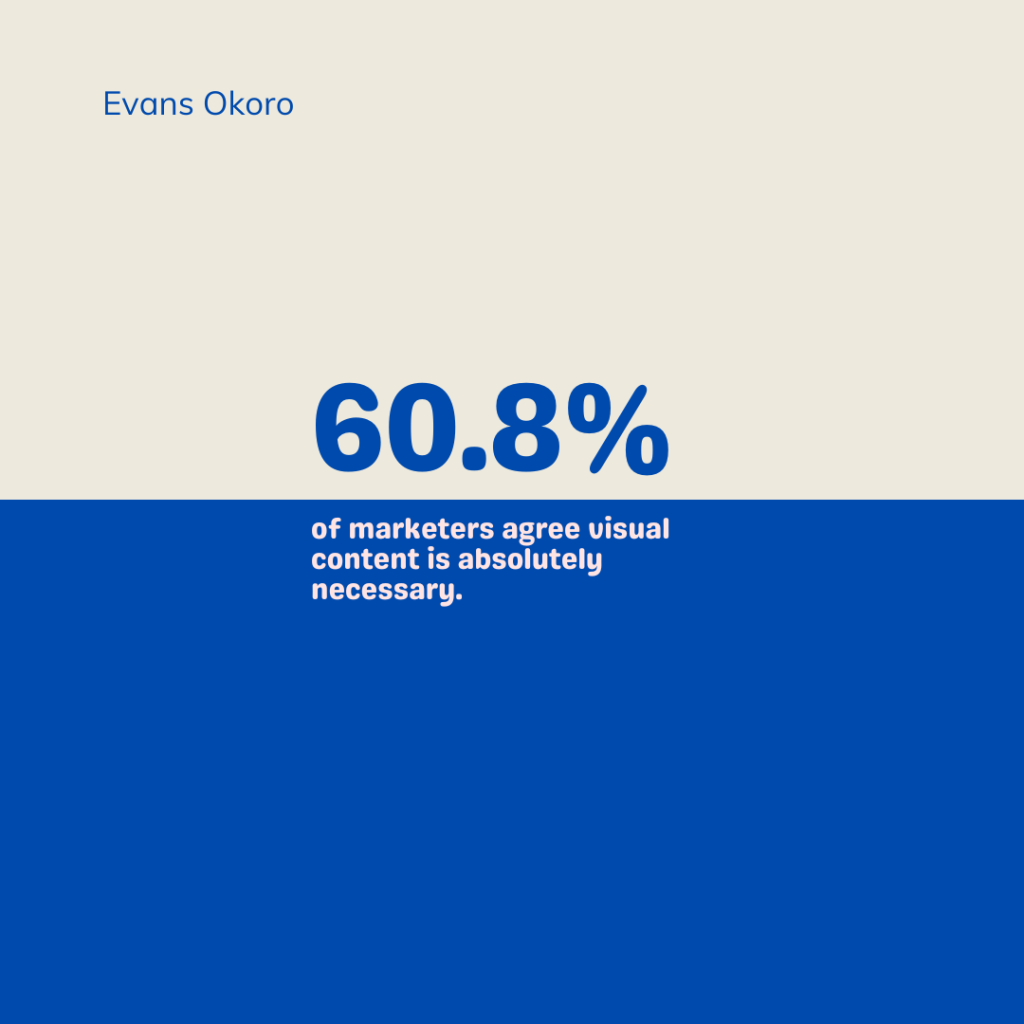
- 31.7 % label visual content as “very important.”
- 46% agree that photography is crucial to their campaigns.
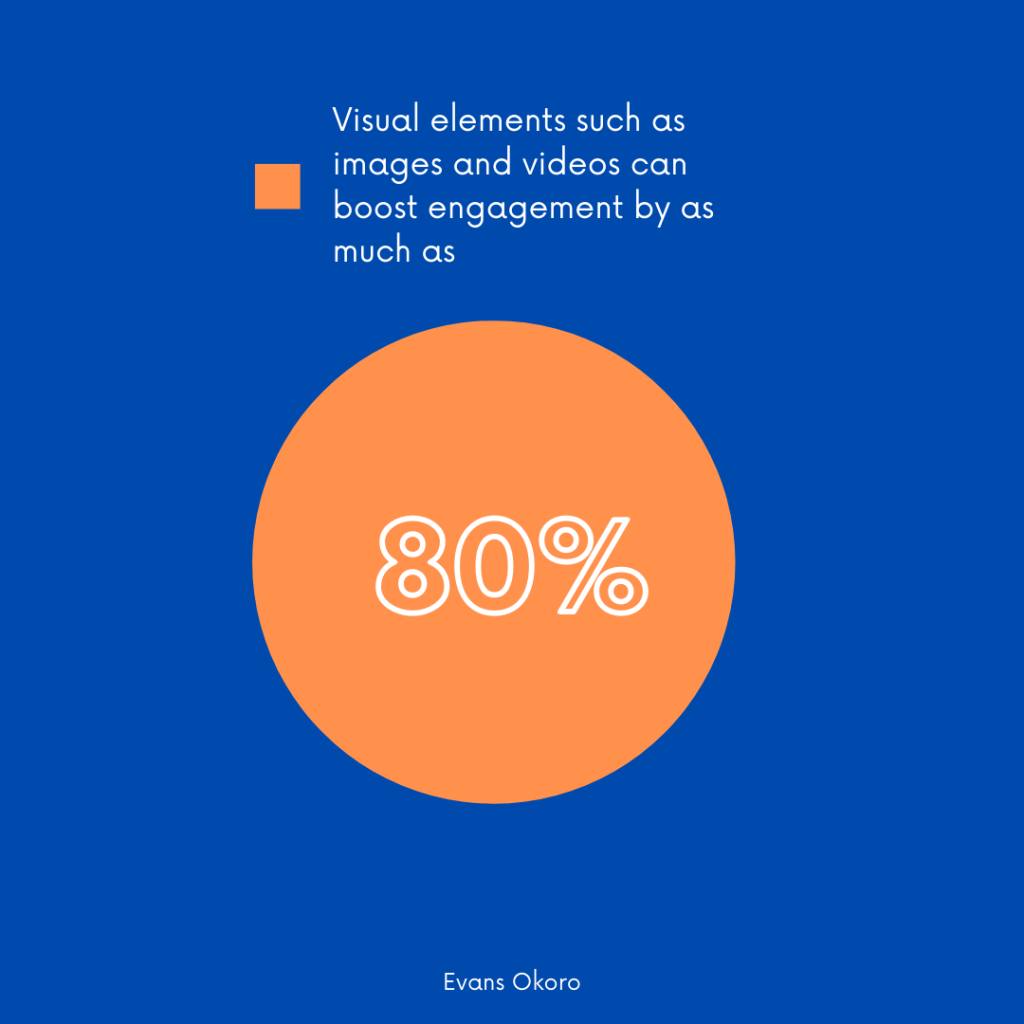
- Colorful visuals make readers 80% more likely to read a document.
- Readers spend an average of 37 seconds on an article.
- According to most marketers, boosting content quality is essential to stay competitive.
- Long-form articles generate nine times more leads.
- 36% of readers prefer list-based titles.
- Listicle headlines with odd numbers outperform those with even numbers by a margin of 20%.
- Users who spent a minute reading an opinion article were 45% more likely to agree with the author.
- 66% of reader attention is spent below the fold.
- Including the term “because” and a justification in your CTAs can boost compliance by 34%.
- Including more than one offer on a landing page can lead to a 266% decrease in conversion rates.
- Positive headlines can provide a 10% increase in clicks from internet users.
- On screens, the average person’s reading speed is 25% slower than reading on paper.
Social Media Statistics
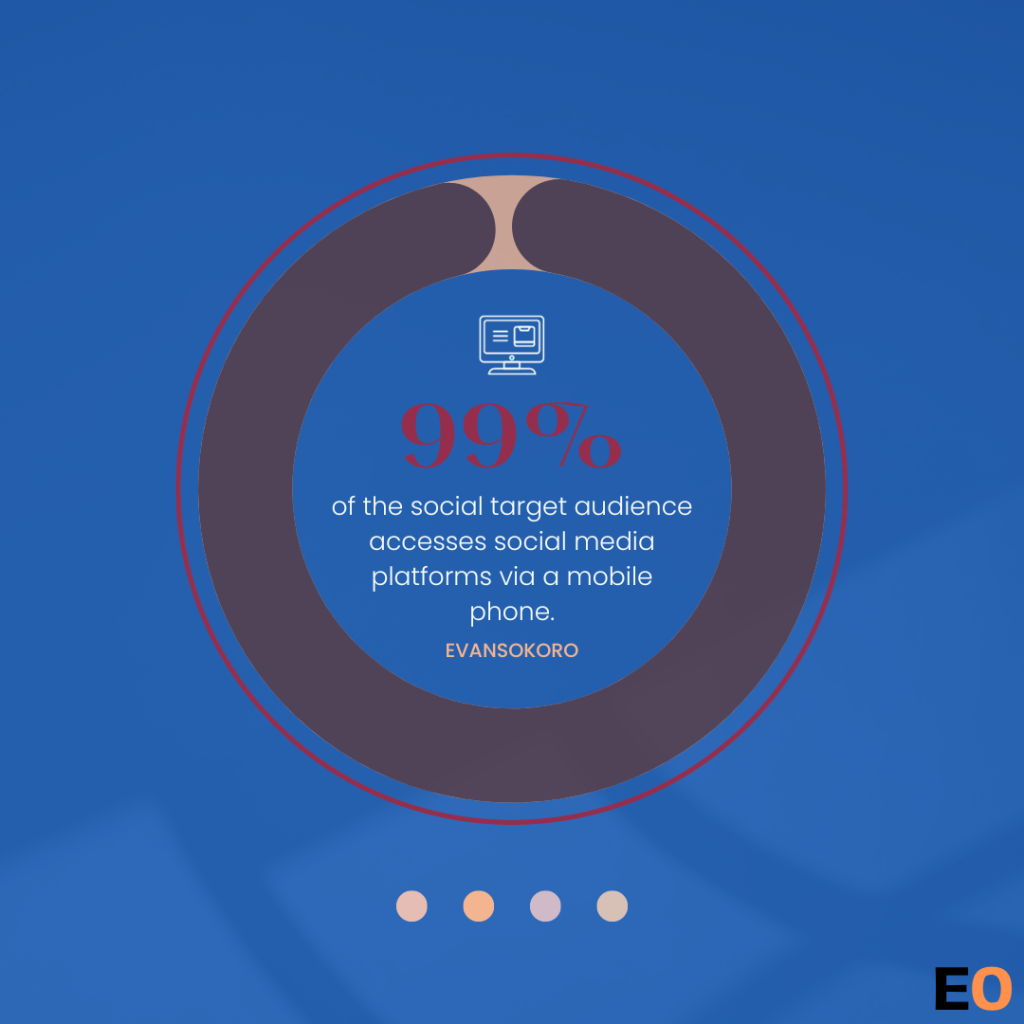
- Almost 99% of global internet users ages 16–64 use a social network.
- On average, people using the internet dedicate around two hours and 22 minutes of their day to social media platforms.
- 52% of people prefer three to six minutes of visual content.
- Internet search is how 45% of people discover instructional and informational videos.
- Most marketers, specifically 85%, consider short-form videos to be the most impactful type of social media content in 2021.
- In 2022, 64% of marketers intend to allocate increased resources towards short-form videos.
- 82% of marketers repurpose content across various social media channels.
- 83% of marketers believe the quality of social media posts is more important than the quantity.
- 54% of social browsers use social media to research products.
- 96% of consumers have watched a posted video to learn more product information.
- Posts on Facebook that are under 50 characters receive the highest engagement.
- Brands experience an almost 50% increase in Twitter engagement, while individuals witness a staggering 100% boost, all thanks to hashtags.
- Facebook posts receive 53% more likes when they include photos.
- Facebook posts with photos earn 104% more comments and 84% more click-throughs.
- Wednesday at 11 a.m. is the optimal time for posting on Facebook.
- Headlines consisting of eleven words tend to accumulate the highest number of shares on Facebook and Twitter.
- 37% of marketers use LinkedIn.
- LinkedIn has over 900 million users, roughly a quarter of them being U.S. internet users.
- LinkedIn is the largest B2B display advertiser in the U.S., at 32.3%.4 of 5 LinkedIn members drive business decisions.
- Over 90% of B2B marketers use LinkedIn for organic social marketing.
X (Formerly Twitter)
- 39% of marketers use X (formerly Twitter).
- Between X and Threads, marketers think they’ll see the most success with X.
- Twitter has over 353 million users.
- In the list of the world’s most visited websites, Twitter ranks #6.
- Twitter is most popular in the United States, followed by Japan.
- Twitter’s audience skews heavily male.
- 82% of B2B content marketers leveraged Twitter for organic marketing in 2021.
- Following the evaluation of multi-destination carousels, Twitter observed an approximate 20% surge in clickthrough rate across all objectives.
- 55% of marketers use Instagram.
- Instagram is one of the most used social media apps among Gen Z.
- Instagram currently has 500+ million active daily users.
- Statista forecasts that Instagram will reach 1.4 billion users in 2025.
- Users spend an average of 12 hours a month on Instagram.
- Facebook and Instagram are tied for first place in social platforms with the highest ROI.
- 21% of marketers leverage Pinterest in their marketing strategy.
- Pinterest has 482 million global active users every month.
- Women make up more than 70% of Pinterest’s global audience.
- 97% of top searches on Pinterest are unbranded.
- Most Pinterest users use the platform to plan new projects.
- Pinterest’s demographics have expanded, with male and Gen Z users growing 40% yearly.
Email Copywriting Statistics
- 347 billion emails are sent daily, with this figure projected to increase to 361 billion by 2024.
- There are currently 4.37 billion individuals with email addresses, projected to reach 4.48 billion by 2024.
- 30% of marketing professionals say email marketing automation’s biggest advantage is saving them time.
- In 2020, 81% of emails were opened via mobile devices.
- If emails not optimized for mobile were opened on a mobile device, approximately 80% of them were instantly deleted.
- 28% of people opt-in to keep up with new sales, coupons, and events.
- 25% opt-in for content updates such as blogs, videos, and other resources.
- 51% of unsubscribed people say it was because the emails came too often.
- 17% felt the emails were too spammy and over-promotional.
- 17% felt the content was low value.
- 10% felt they were not receiving the content they expected.
- 34% said there were too many emails in a day.
- 17% said there were too many emails in a week.
“69% of email recipients mark an email as spam based on the subject line alone.”
- 86% expect to see emails from brands at least monthly.
- 68% of people want to see marketing emails weekly.
- 15% want to see emails every day.
- For every $1 spent on Email marketing, an average ROI of $36 is generated.
- 96% of people earning $75,000 – $99,900 wanted to receive promotional emails from brands they were subscribed to.
- 92% of people earning over $100,000 wanted to receive promotional emails from their subscriptions.
- 47% of email recipients say they open an email based on the subject line alone.
- 69% of email recipients mark an email as spam based on the subject line alone.
- Personalized subject lines with a name included will boost open rates by 10-14%.
- Monday was the best day, with the highest email open rates at 22%.
- Tuesday was the day with the highest click-through rates, at 2.4%.
- Businesses that conduct A/B split tests on email marketing observe an 82% increase in return on investment compared to those that do not engage in split tests.
- Animated gifs in emails generate a 105% higher ROI than emails that do not have any gifs.
“Using the word “free” in the email subject lines can increase open rates by up to 29%.“
SEO Copywriting Statistics
- 69% of marketers invested in SEO.
- 71% of SEO investments were in keywords.
- 50% invested in Localization.
- 48% invested in mobile optimization.
- Web visitors are 70% less likely to click on an ad if there are spelling and grammatical errors.
- As a result, Google changed its pricing policies and charged more for ads with spelling and grammatical errors.
- 72% more for ads with grammatical errors.
- 20% more for ads with clear spelling errors.
Personal Branding Statistics
- 88 percent of consumers say that authenticity is a key factor when deciding what brands they like and support (Stackla, 2021).
- People are willing to pay a premium of up to 13.57 times the standard rate for services rendered by people deemed to be elite experts in comparison to an average person. (Hinge Marketing)
- Leads developed through employees’ social media activities convert 7 times more frequently than other leads.
- Sales reps who use social media as part of their sales techniques outsell 78 percent of their peers.
- Ninety-two percent of people trust individual recommendations (even if they don’t know them) over brands.
- Marketers who prioritize blogging are 13 times more likely to enjoy positive ROI.
- Consistency is key. It takes five to seven impressions for someone to remember a brand.
- When employees on social media share brand messages, they get 561 percent more reach than those shared by the brand’s social media channels.
- Brand messages are re-shared 24 times more frequently when posted by an employee versus the brand’s social media channels.
- Employees have 10 times more followers than their company’s social media accounts on average.
- Content shared by employees receives 8 times more engagement than content shared by brand channels.
- Out of all business decision-makers, 84% start their buying process with a referral. And Google is the very first place people look after getting a referral.
- Of all Internet users, 65% see online search as the most trusted source of information about people and companies. That’s a higher level of trust than any other online or offline source.
- 53% of decision-makers have eliminated a vendor from consideration based on information they did or did not find about an employee online.
- Regarding your brand, it’s better not to risk it. It takes about 50 milliseconds (0.05 seconds) for people to form an opinion about your website (8ways, 2019).
- 3 in 4 consumers (74 percent) say transparent communication has become more important after the COVID-19 pandemic (Salesforce, 2022)
Branding Statistics
- 81% of consumers need to trust a brand before purchasing.
- 77% of consumers have expressed their preference for shopping with brands that they follow on social media.
- 65% of consumers say a brand’s CEO and employees influence their decision to buy
- 55% of brand first impressions are visual
- There are more than 10,000 branding and positioning agencies operating worldwide.
- Gen Zers mainly use Instagram to research brands
- Baby Boomers primarily to use Google to research brands
- Consumers are 81% more likely to recall a brand’s color than remember its name (Reboot)
- 86% of job seekers read company reviews before applying for a job (Glassdoor)
- On average, companies with strong employer branding receive 1.5x more applicants (LinkedIn)
- Strong employer branding can increase retention by as much as 28% (LinkedIn)
Landing Page Statistics
- A mere alteration to your landing page can lead to a reduction of 266% in conversion rate.
- Longer content tends to achieve higher search engine rankings, with the optimal word count being approximately 1,600 words.
- 78% of landing pages load within 5 seconds or less. The initial five seconds of page load time greatly influences your conversion rates. Each second of load time results in a 4.42% decrease in website conversion rates.
- Personalised calls-to-action (CTAs) outperform generic ones by a staggering 202%.
- Landing pages constitute 5.1% of all enabled sign-up forms, while popups currently comprise approximately 66% of all signup forms.
- Having 10 to 12 landing pages can drive a 55% increase in leads. The more landing pages you have, the more leads you can generate.
- Just 17% of marketers utilize A/B testing to optimize landing pages. Employing split testing can enhance conversions on landing pages.
- Including videos on landing pages boosts conversions by 86%. Nowadays, the majority of customers prefer watching videos rather than reading text.
- Lead magnets account for 55% of landing page submissions. Landing pages that offer lead magnets tend to yield the highest conversion rates.
- Adding contact information to your landing pages boosts signups by 14.8%.
“Testimonials can be found on approximately 36% of the top landing pages. These testimonials, alongside social proof, play a vital role in boosting conversion rates on landing pages.”
FAQs
Can copywriting statistics help in understanding consumer behavior and preferences?
Yes, copywriting statistics provide valuable insights into consumer behavior. Analyzing data on consumer preferences, such as preferred content formats and topics, empowers you to tailor your copy to align with audience expectations, resulting in more effective communication.
How can incorporating industry-specific data enhance the relevance of copy?
Industry-specific data adds relevance to your copy. Studies show that content incorporating industry statistics receives 34% more engagement. By leveraging sector-specific data, you can create copy that speaks directly to your target audience, making it more impactful and relatable.
How does using customer testimonials and case studies impact the credibility of copy?
Customer testimonials and case studies are powerful persuasion tools. Copy enriched with statistics from testimonials can build trust, with 92% of consumers trusting recommendations from peers. Including quantifiable results in testimonials strengthens the credibility of your copy.
In what ways can copywriting statistics help in adapting content for different channels and platforms?
Different channels and platforms have unique user behaviors. Copywriting statistics offer valuable information on user engagement across various channels. Adapting your copy based on this data ensures that your messaging is well-suited for each platform, maximizing its impact.
Can copywriting statistics contribute to brand authority and thought leadership?
Absolutely. Establishing authority is key in copywriting. By incorporating industry-specific data, market trends, and relevant statistics, your copy positions your brand as a thought leader. This fosters trust and credibility among your audience.




One Comment